
TWIPLA (Visitor Analytics): An Honest Review
About this review
I embarked on a journey to rigorously test some of the prominent analytics solutions, and Twipla (formerly Visitor Analytics) is one of them. This review is based on my personal experience and observation of the its features and use cases. My ultimate goal is to provide you with a transparent, detailed, and unbiased view of the platform, aiding you in making an informed decision about whether it’s the right tool for you.
First off, who is it for?
Visitor Analytics might be particularly relevant in you fall into one of these scenarios:
- You’re Considering an Alternative to GA4: If you’ve been struggling with Google Analytics 4 (GA4) are thinking about alternatives, Visitor Analytics might be a good option thanks to an incredibly user friendly interface, interesting features and straightforward compliance with GDPR and other privacy laws.
- You’re Looking for a Unified Solution: If you’re yearning for a one-stop solution that combines traditional web analytics and reporting with tools like heat maps and screen recordings, this platform could be the answer.
- You’re Going Cookieless: If the main driver is to switch to technology that does not rely on third-party cookies, this can be a great option to consider, also thanks to their privacy management features which allow you to further narrow down the type of data you collect.
In my experience, most people get started with Twipla for their core reporting features, and then expand to all of the other functionalities their offer. But let me tell you more about the product.
Note: the video below was shot a few days before Visitor Analytics rebranded as Twipla. The product and features haven’t changed, just the name has.
Product Overview: More Than Web Analytics
Unlike traditional analytics solutions Twipla offers a comprehensive suite of products that include different leads management, user behavior and communication tools. In fact for companies that do not have too advanced use cases, their software might replace several other tools, not just your analytics one. Let me show you what the platform is all about.

Core Analytics Features
Website Analytics
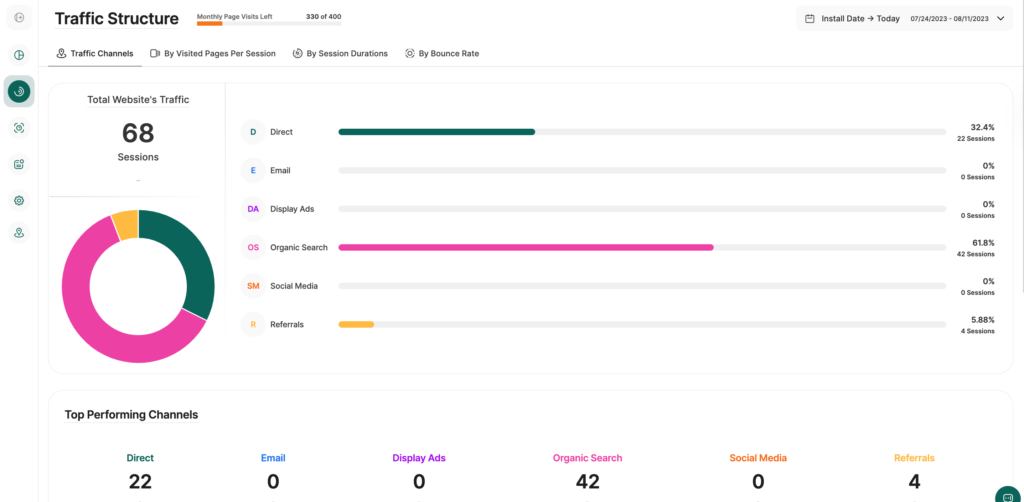
Twipla offers a comprehensive suite of tools to track and analyze website performance, offering a lot of the reports and functionalities you are already familiar with from Google Analytics or similar solutions. We are talking about metrics such as the number of returning and new visitors, the average sessions per user, pages by number of page views, geo-location data, campaign-level data and so on. If you are used to Google Analytics, you’ll find out that aside from a different UI, a lot of the data you’d normally look at there, is also available here. There are some differences of course. It does not natively connect to Looker Studio, it does not offer an attribution module, and some other functionalities are not there. But all in all, it is a data rich platform that does an excellent job at collecting and reporting on user journeys and events.
Privacy Center
In an era where data privacy is paramount, Visitor Analytics prioritizes user trust with its Privacy Center. The platform introduces Custom Country Data, allowing users to tailor their analytics dashboard based on country-specific data privacy laws. This ensures that businesses remain compliant while catering to a global audience.
Twipla stands out by offering customizable privacy settings. Users can choose from a range of options that best align with their needs and the data protection regulations of their country. A notable feature is the platform’s commitment to cookieless tracking, ensuring that user data is handled with the utmost care.
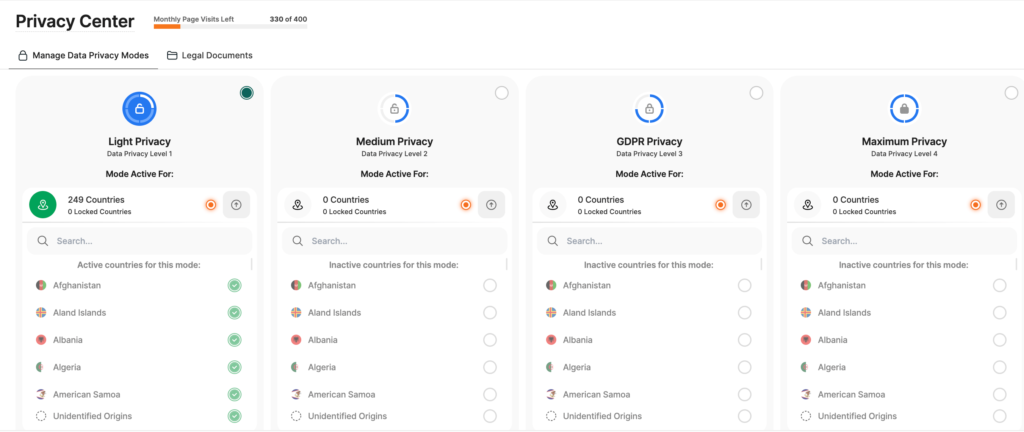
The platform offers four distinct levels of privacy, ranging from Light Privacy, which displays all visitor information, to Maximum Privacy, which offers the pinnacle of data protection by aggregating data without any links to personal information.
Company Reveal for Enhanced B2B Insights
For B2B SaaS companies understanding who visits their website can be transformative for two reasons:
- Better nurture the existing sales pipeline
- Identify new targets for outbound sales and ABM
Their Company Reveal feature does precisely that. It identifies companies that have visited a website, offering insights that can be leveraged for Account-Based Marketing campaigns, sales and even Ideal Customer Profile (ICP) development.
The tool goes beyond just identifying companies. It helps businesses understand the intent behind these visits. For instance, if a target account frequently visits high-intent pages, such as pricing, this data can be used to enhance ABM strategies. Furthermore, by revealing companies that show interest but haven’t converted, businesses can refine their outreach strategies and potentially turn these visits into sales pipelines.
Custom Event Tracking
Without custom events, there is little you can do to truly understand user journeys and conversions on your site. By creating unique trackable event tags, users can observe how visitor interactions evolve over time. The platform also offers an auto-scan feature, which identifies default elements like forms and buttons without requiring additional code. To help users manage vast amounts of data, the platform organizes events in an easy-to-understand table format, complete with filtering and grouping options. This ensures that users can quickly identify which events are triggered most frequently.
User Behavior and UX
Conversion Funnels Analytics
Understanding the customer journey is pivotal for any online business. With Conversion Funnels Analytics, Twipla offers a visual tool that showcases the conversion rates of vital processes on a website. This tool is indispensable for digital marketers aiming to optimize their strategies. By visualizing the customer journey, from the homepage to the final conversion point, businesses can identify potential drop-off points. The platform allows users to set up and monitor these funnels effortlessly. Users can define various levels of their marketing funnels, track visitor drop-offs at each stage, and gain insights into the most and least effective parts of their website.
Website Heatmaps
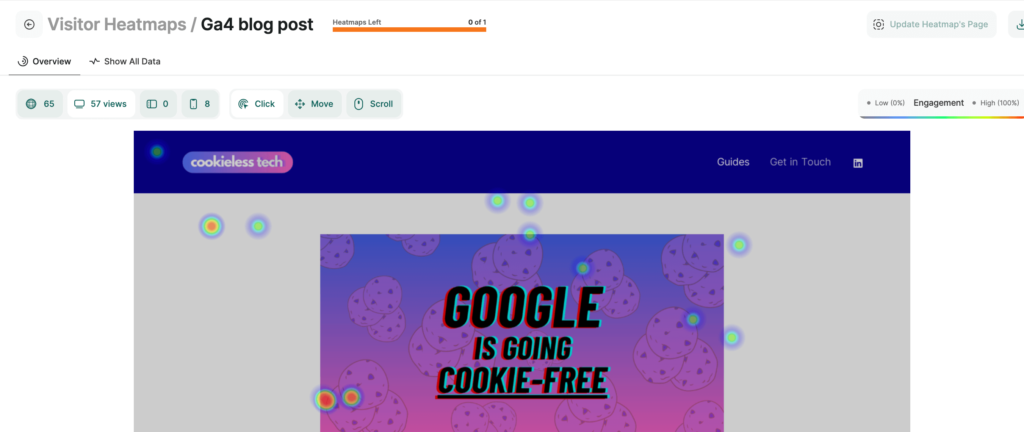
To provide a more intuitive understanding of user behavior, Twipla offers Heatmaps. This module gives you a visual representation of areas on a webpage where user activity, such as clicks or taps, is most concentrated. Warm colors indicate high activity, while cooler colors or lack of color signify less interaction. The way it works is very similar to other tools (eg: HotJar) and you can quickly set up heatmaps for specific pages or groups of similar pages. The platform differentiates between interactions on desktop and touchscreen devices, providing separate heatmaps for clicks and taps. Additionally, the platform displays a map highlighting the top five countries where website visitors are most active, aiding businesses in tailoring their strategies for specific regions.
Website Session Recordings
Twipla’s Session Replays tool offers a deep dive into user interactions on websites. It captures visitor sessions, highlighting their navigation patterns, time spent, and device details. This tool is invaluable for pinpointing usability issues and understanding user challenges. With robust filtering capabilities, users can quickly sift through recordings to find relevant data.
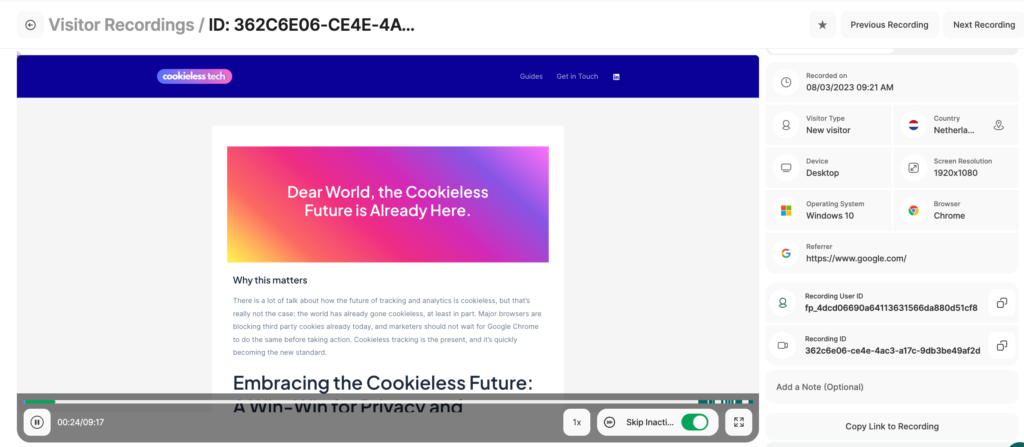
Additionally, the platform allows for customized recording settings, ensuring that businesses capture only the most pertinent interactions.
On-page Communication
Surveys
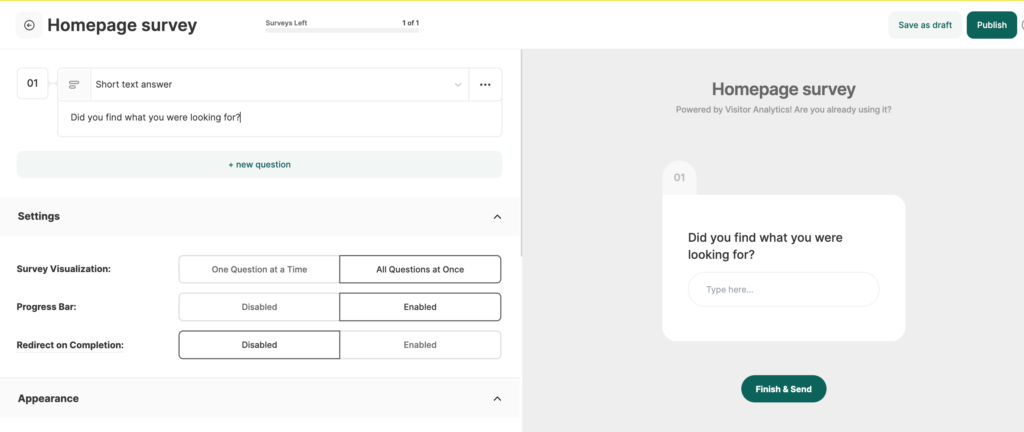
Twipla offers a comprehensive Surveys feature that allows website owners to gather direct feedback from their audience. Setting up a survey is a breeze, with the ability to reuse saved questions from a personal question bank that’s shared between polls and surveys. Users can select from a variety of preset main question categories, including short/long text questions, multiple choice, slider rating scales, and more. The platform also provides customization options for branding survey pages, allowing users to decide on the appearance and progression of their surveys. Once the survey is live, users can gain in-depth insights about survey responses, viewing general statistics, individual survey results, and detailed participant information. This includes metrics like response numbers, average completion time, bounce rates, and funnel analysis.
Polls
With the Polls feature, Visitor Analytics enables website owners to integrate quick feedback bubbles directly onto their web pages. The user-friendly interface ensures that creating polls is a straightforward process. Like with surveys, there’s a shared question bank, and users can choose from various preset question categories. The platform emphasizes customization, allowing users to define where polls appear and to whom they’re visible. This means polls can be displayed universally or only on specific URLs and to particular visitor types. Branding is also a focus, with options to select bubble colors, positioning, and even include logos. Once polls are active, users can differentiate between general statistics, individual poll results, and participant details. This provides a holistic view of how visitors are interacting with the polls and the feedback they’re providing.
Customer Reviews
I think vendor review platforms like G2 and Capterra show who is better at collecting reviews, rather than who has the best product. Having said that, it’s still fair to report those here, and ultimately it is interesting to see what aspects of the software are the most liked (or disliked) by their user base.
| G2 | Capterra | Wiz | SoftwareSuggest | |
|---|---|---|---|---|
| Average rating | 4.4 / 5 | 4.7 / 5 | 4.5 / 5 | 4.9 / 5 |
| Number of reviews | 30+ | 350+ | 1,500+ | 40+ |
Most reviews are overwhelmingly positive. The only remarks from the reviews available online seem to be about adapting to a new platform and leaving behind some of the processes or features they were used to.
This is like Google Analytics on steroids. It has so much functionality and it’s really simple to get started and set up. I love it because I can track visitor metrics to my websites — and my clients’ websites.
Jay K. – from a G2 Review
Ultimately, if that is something you want to rely on, the feedback from customers seems extremely positive.
Pricing
One thing I like about their pricing model is that it is not full of add-ons, and their tier segmentations is super simple. It is primarily based on usage (page view per month and session recordings per month) although specific features (like company reveal) require higher plans.
| Page Views / Month | 10,000 | 25,000 | 50,000 | 100,000 | 200,000 |
|---|---|---|---|---|---|
| Monthly price | $10.39 | $19.99 | $31.99 | $62.39 | $123.20 |
| Country Data | – | ✓ | ✓ | ✓ | ✓ |
| Company Reveal | – | – | ✓ | ✓ | ✓ |
While the price is in most case higher than other competitors, it is important to consider the broader scope offered by the tool. For example HotJar would cost you over $70/month for the same usage you can cover with Twipla’s $31.99 plan. The same applies if you use a separate solution for revealing which companies are being your website visits. So instead of just comparing it to other tracking solutions, Im would advise to consider their pricing as a whole, which would make it a very attractive options, and way cheaper than purchasing multiple tools separatly.
Pricing compared to other cookieless analytics solutions
| Page Views / Month | 10k | 50k | 100k | 1M |
|---|---|---|---|---|
| Simple Analytics | $21 | $21 | $21 | $65 |
| Matomo | $21 | $21 | $39 | $175 |
| Fathom | $14 | $14 | $14 | $54 |
| Seal Metrics | $10 | $10 | $21 | $76 |
| Twipla | $10 | $32 | $63 | custom |
| Plausible | $9 | $19 | $19 | $69 |
| Pirsch | $6 | $12 | $12 | $54 |
| Data Centurion | $6 | $10 | $13 | $18 |
| Swetrix | $5 | $16 | $16 | $59 |
Alternatives
Analytics
We covered the cookieless analytics landscape here and below as some of the solutions that are most likely to be considered good alternatives to Twipla.
- Matomo
- Fathom
- Pirsch
- Simple Analytics
- Plausible
- Adobe Analytics*
- Google Analytics 4*
* not cookieless by default
Out of the solutions listed above, Matomo is probably the one that offers the most similar value, as it includes several of the features Twipla does, like screen recordings for example. Pirsch would probably be the best alternative from a budget standpoint, but it lacks many of the functionalities offered by Twipla.
Heatmaps and Session Replay
The session recording and replay landscape is pretty crowded. There are free solutions like Microsoft Clarity (whose interface I really am not fond of) to dedicated paid solutions like HotJar that offers tons of other features beyond heatmaps and screen recording.
- Hotjar
- MouseFlow
- Contentsquare
- Glassbox
- Microsoft Clarity
While for advanced use cases Twipla may not replace the solutions above, for a lot of small and medium-sized companies it is a great way to gain those insights without paying for an additional tool.
User engagement
Surveys and pools are a great way to collect insights from your user base or your website visitors. The functionalities offered by Twipla are good enough for most use cases. There are however dedicated solutions like the ones below for compnies that have very specific needs:
- Hotjar
- Jotform
- Typeform
Should you go for Twipla?
In my experience, Twipla is an amazing solutions that would cover the digital analytics and user behavior needs of most companies, especially startups or SMB looking for a privacy-focused, all-in-one solution. Like other cookieless software, Visitor Analytics does not require a cookie banner and is future-proof when it comes to privacy laws.
The setup is very easy (although that’s the case for most software of this kind) and their UI is incredibly user friendly. I especially like how everything is in one place and you really don’t need much time to familiarize with how to do things in the platform. If you have multiple domains, it is also super easy to switch from one to the other using the dropdown in the top-left on the dashboard.
Ultimately, this is a solution I would genuinely recommend to anyone that needs a 360 overview of how users engage with your website, this platform is for you.